AlphaNew FeaturesImprovementsFixes
XFlow Charts Version 0.330 Release Notes
This is the largest update since the apps launched, and the first one to reach the website, the desktop app and the phone app on the same night.
The theme is one platform: replay behaves like the live market, every device reads its data the same way, and what you loaded once stays loaded. The follow up updates of the same week are included below.
Backtesting and Replay
- Entering a backtest keeps your window exactly as it is. Replay now runs on the live chart itself, with one clock for every window of the session.
- One control bar per replay session that you can drag from anywhere, with Space and the arrow keys driving the run from any window.
- An arrow key step is now an instant skip of one candle.
- Time & Sales and DOM windows join the replay, and you can trade the replay straight from the DOM ladder.
- One backtest trading engine shared by every window, with simulated account rules enforced in replay exactly as they are live.
- The replay controls show the progress of the session, and the replay button becomes Exit while a backtest runs.
- In a backtest, a TP or SL dragged from the position follows it the same way, exactly as on a simulated account.
DOM
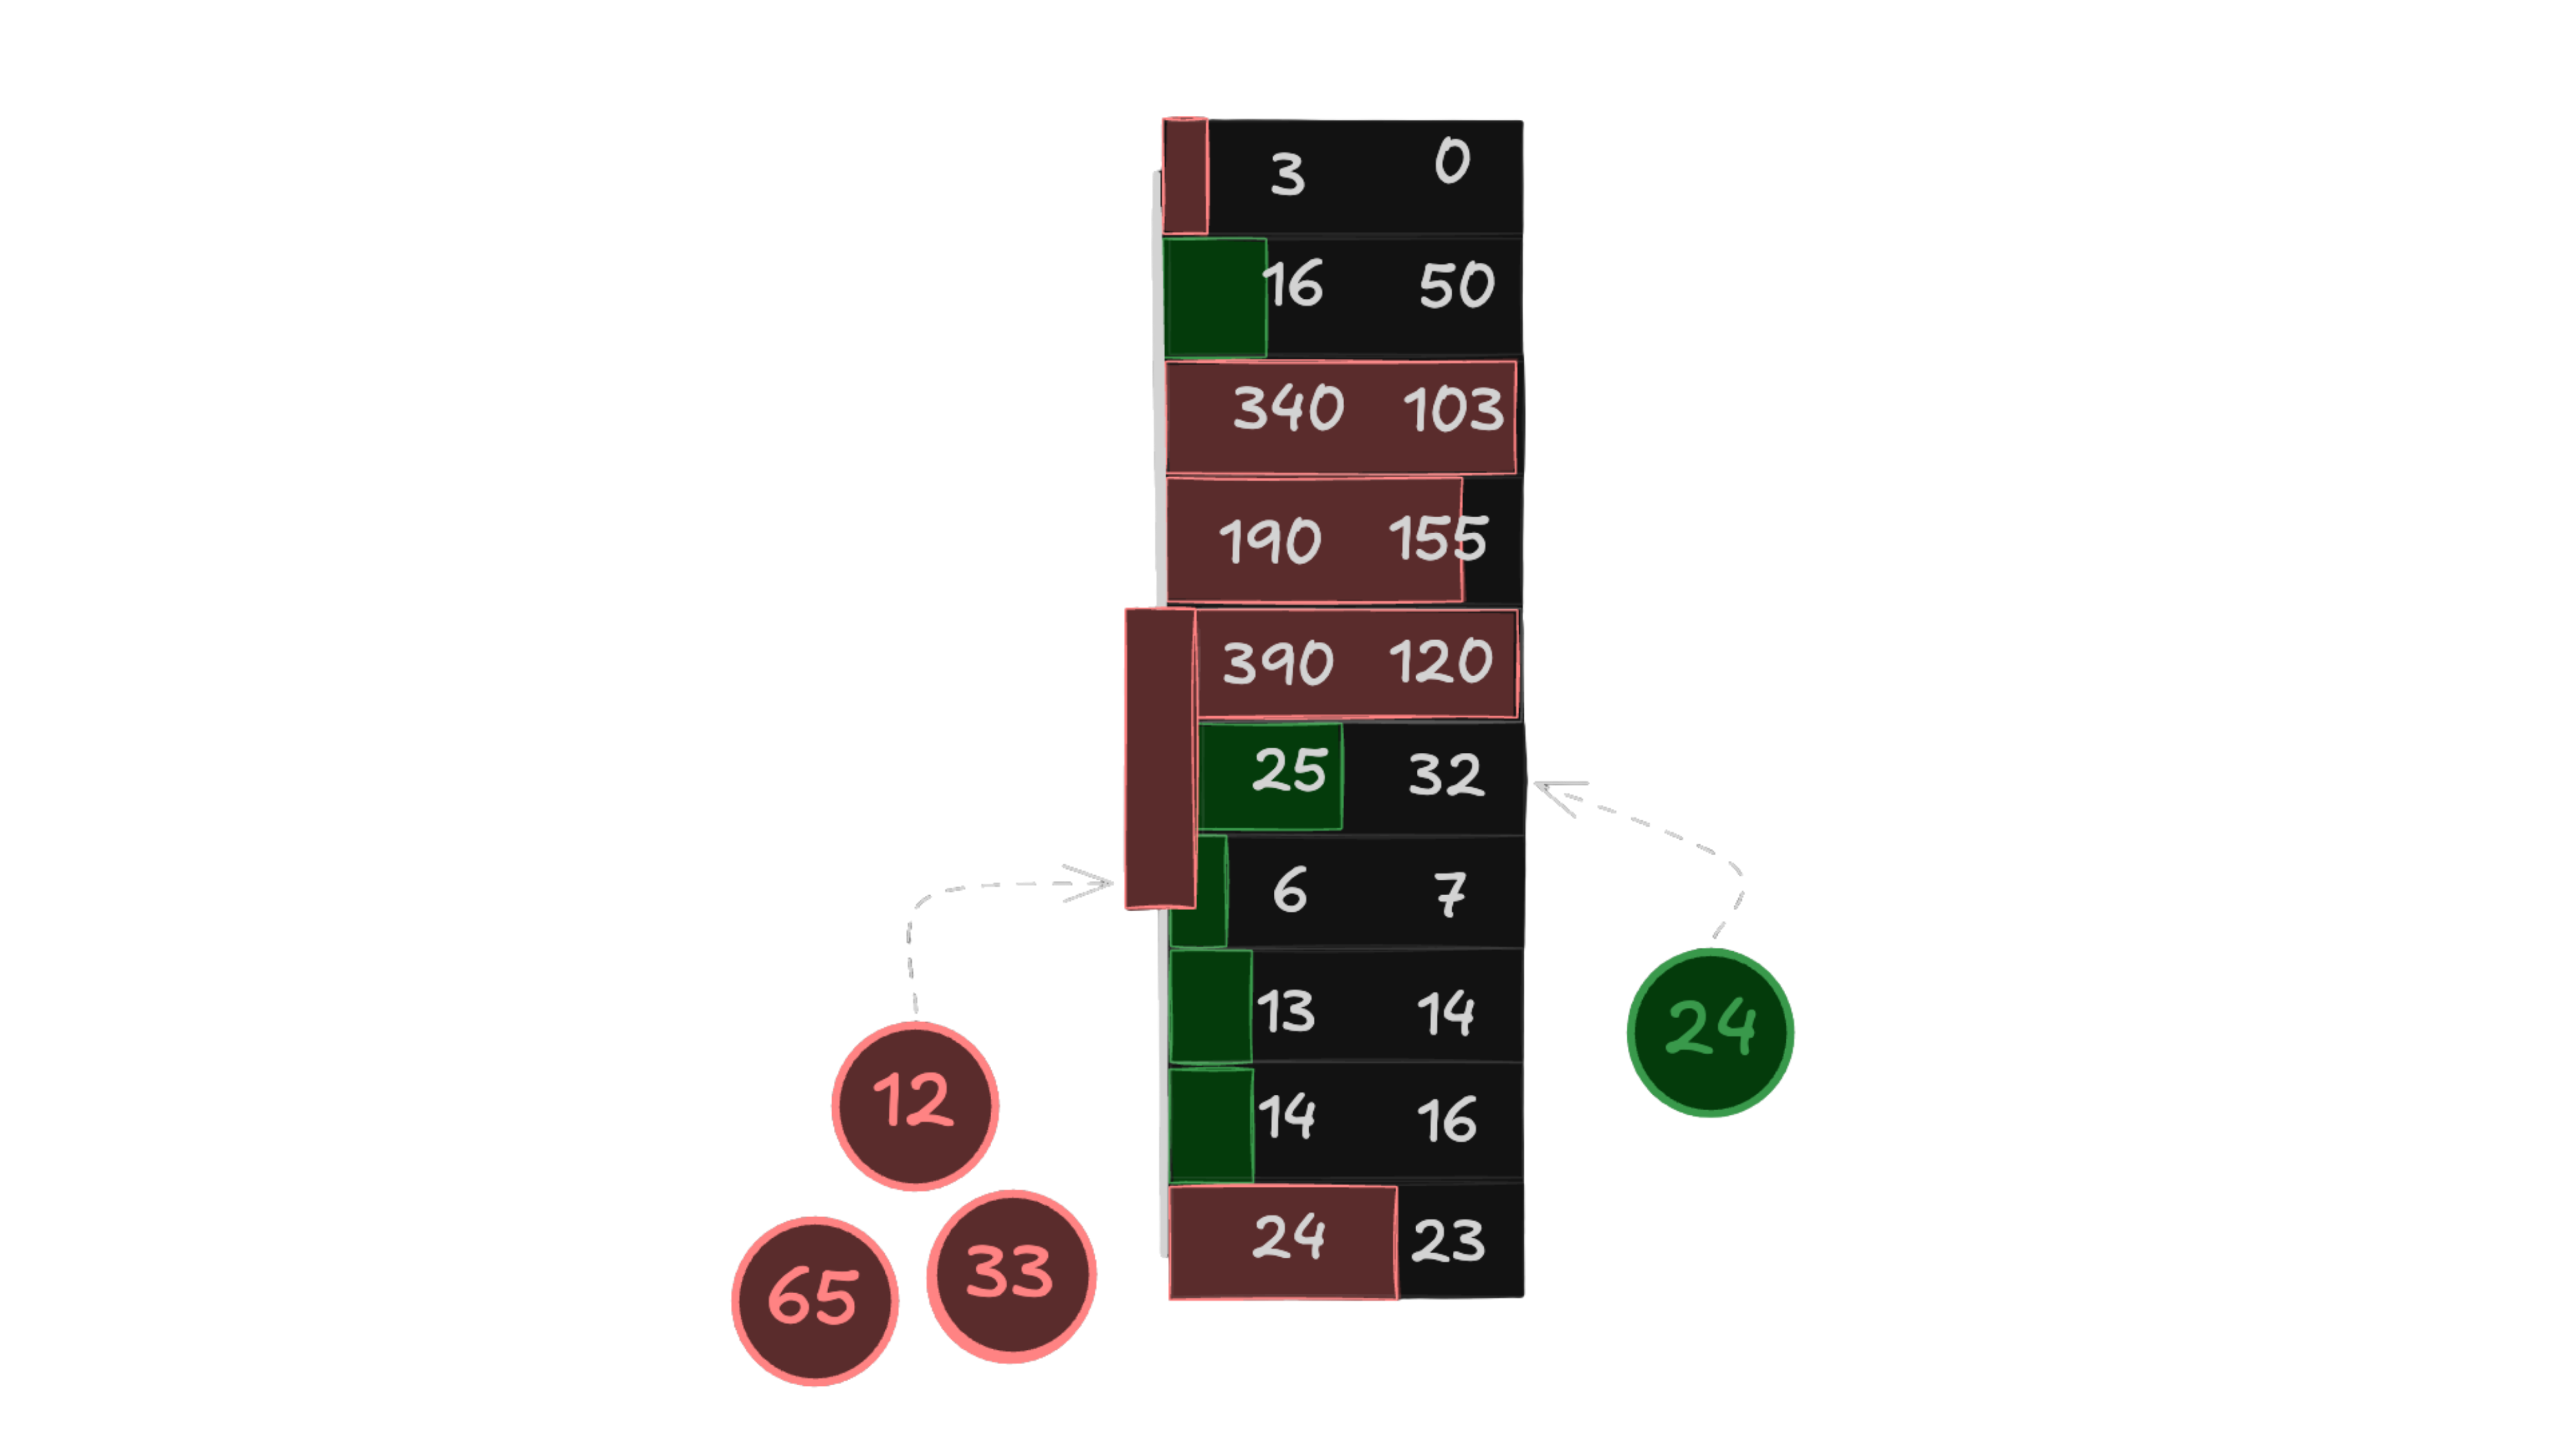
- DOM ladder rebuilt with movable columns, order outlines, a range limit and a cell flash that has its own switch, duration and minimum size per column.
- Alignment per column, size bars that face each other or away, and separate border colours for the Bid and Ask columns.
- In a position, the Price column is shaded in the P&L colour from your entry to the current price, and your last fill flashes in its cell.
- Pull and stack and traded volume columns can expire on a rolling or fixed window, and the ladder rows stretch when you drag the Price column.
- The DOM ladder does far less work on every update, which keeps split layouts with several ladders smooth.
Trading
- With OCO on, the take profit and stop loss of a position now always match its size. They grow with every added fill and shrink with every reduction.
- On Rithmic accounts the server now sizes linked TP and SL orders to the position.
- A TP or SL placed by clicking its button and then the chart now belongs to the position, the same as a dragged one.
Charts and Indicators
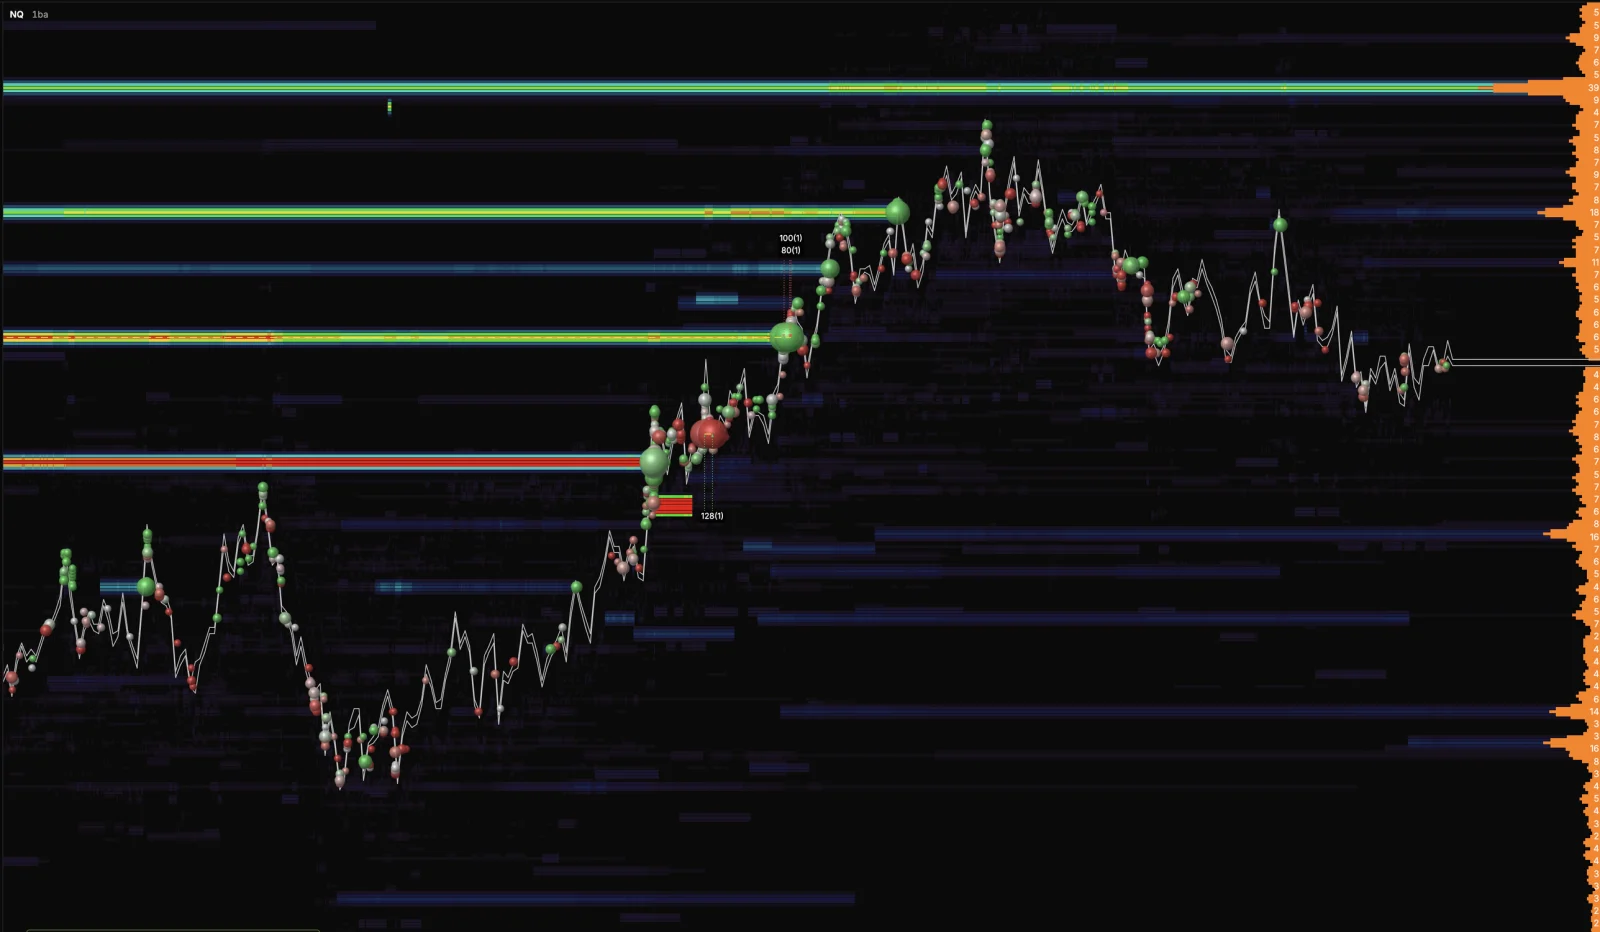
- Heatmap Liquidity and Contrast sliders now sit in the toolbar, and tick grouping can be set to On, DOM only, Heatmap only or Off.
- Tick volume bubbles are sized against the screen and grouped by aggressive order, with two sliders for size and grouping.
- Tick volume bubbles have a new default grouping that merges bubbles at the zoom you are looking at, so touching dots never overlap. Every earlier mode is still available.
- Daily, weekly and monthly charts gain a Max history depth.
- Drag a chart tab to change its place in the strip, and find the frame controls in the right click menu of every chart.
- Click Open P/L or Daily P/L to flip between money and ticks everywhere, edit a text drawing in place, and place an order from the right click menu.
- One trusted clock for sessions, days, countdowns and the live edge, so a computer clock that runs fast or slow no longer shifts your chart.
Data and Loading
- Market data is kept once it is loaded. Closed days are never requested again, and a reload asks only for the gap since you were last here.
- Charts recover by themselves after sleep, suspend or a frozen tab, and keep the screen awake while they are open.
- Rithmic history downloads run as one ordered queue per device, and the loading cover shows the real speed of the line.
- A Rithmic chart draws its heatmap history from its own recording after a reload.
Apps
- New desktop app 1.0.50 and 1.0.51 for macOS and Windows.
- New phone app 1.0.55 for Android, with the iPhone build rolling out through the App Store.
- On the phone, the plus button places a Depth of Market, Time & Sales or Tick Heatmap frame on the screen, and the DOM is now usable on a phone display.
- Chart Settings shows the version of the app you are running.
- The desktop and phone apps now show a New version available pop up with Download and Later.
Fixes
- Fixed a Footprint added to a chart showing before its cells were ready. The loading cover now stays until they are drawn.
- Fixed hiding one TPO breaking another, and session TPO merges now join RTH with RTH and ETH with ETH.
- Fixed pop out windows on a workspace switch. The old ones close before the new ones open.
- Fixed a live position being marked at the price of a backtest you had just exited.
- Fixed windows staying on Connection lost after exiting a backtest.
- Chart text now survives browser page translation.
- A chart window that the browser froze in the background now comes back without freezing the screen, and its Tick Heatmap returns at once.
- Fixed a take profit placed by clicking the chart being refused on its profit side.
- Fixed an older copy of an indicator putting a previous setting back over a newer edit.
- Fixed a stray outline under single print rows in TPO profiles.
- Fixed the drawing toolbar slipping away from the pointer on its first grab.
Final Notes
This release made the website, the desktop app and the phone app behave as one product.
It also closes months of work on how data is stored and loaded, which is what makes everything after it faster.