AlphaNew FeaturesImprovementsFixes
XFlow Charts Version 0.323 Release Notes
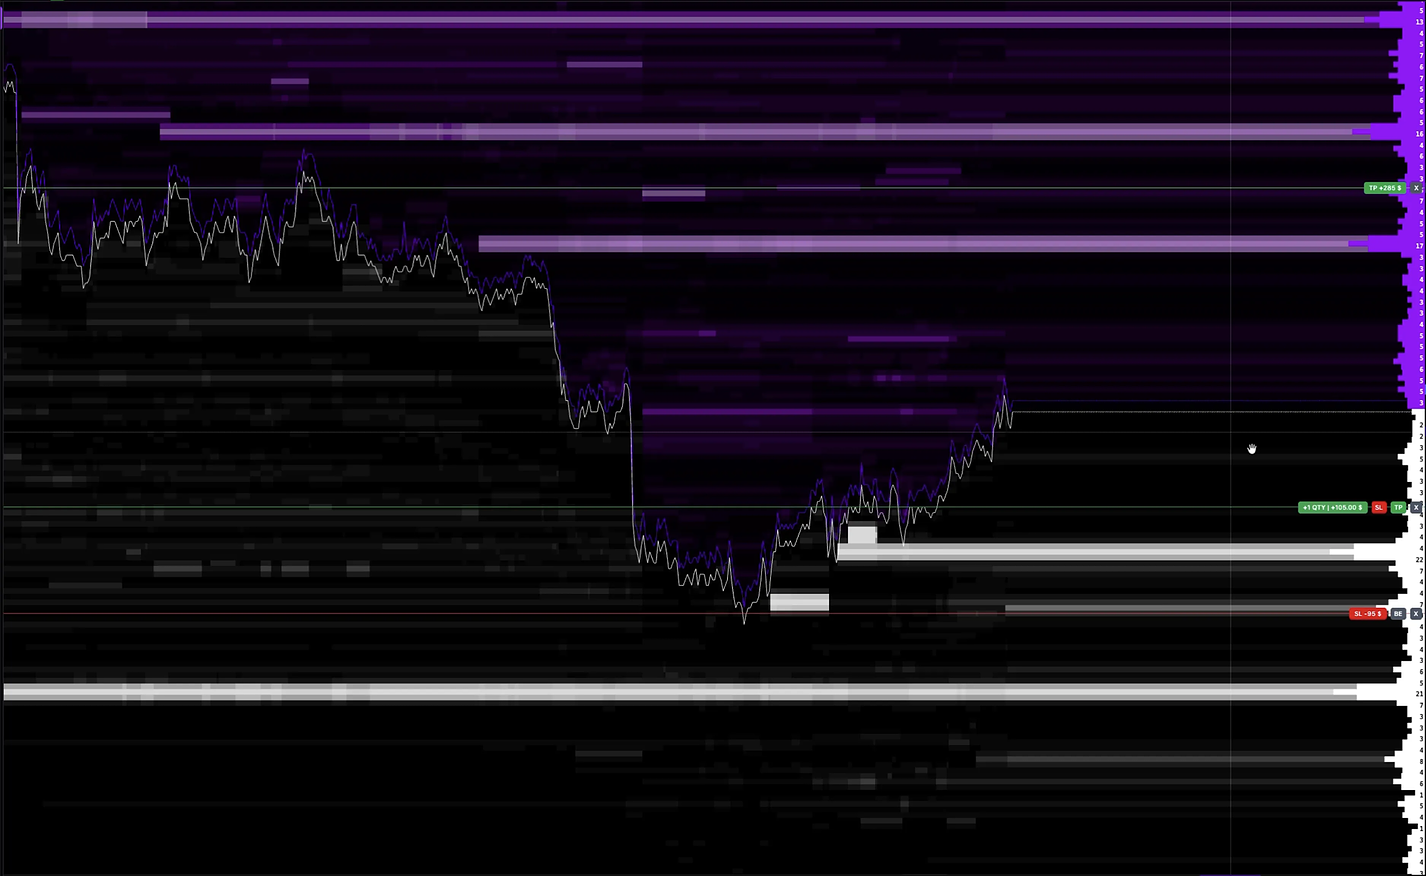
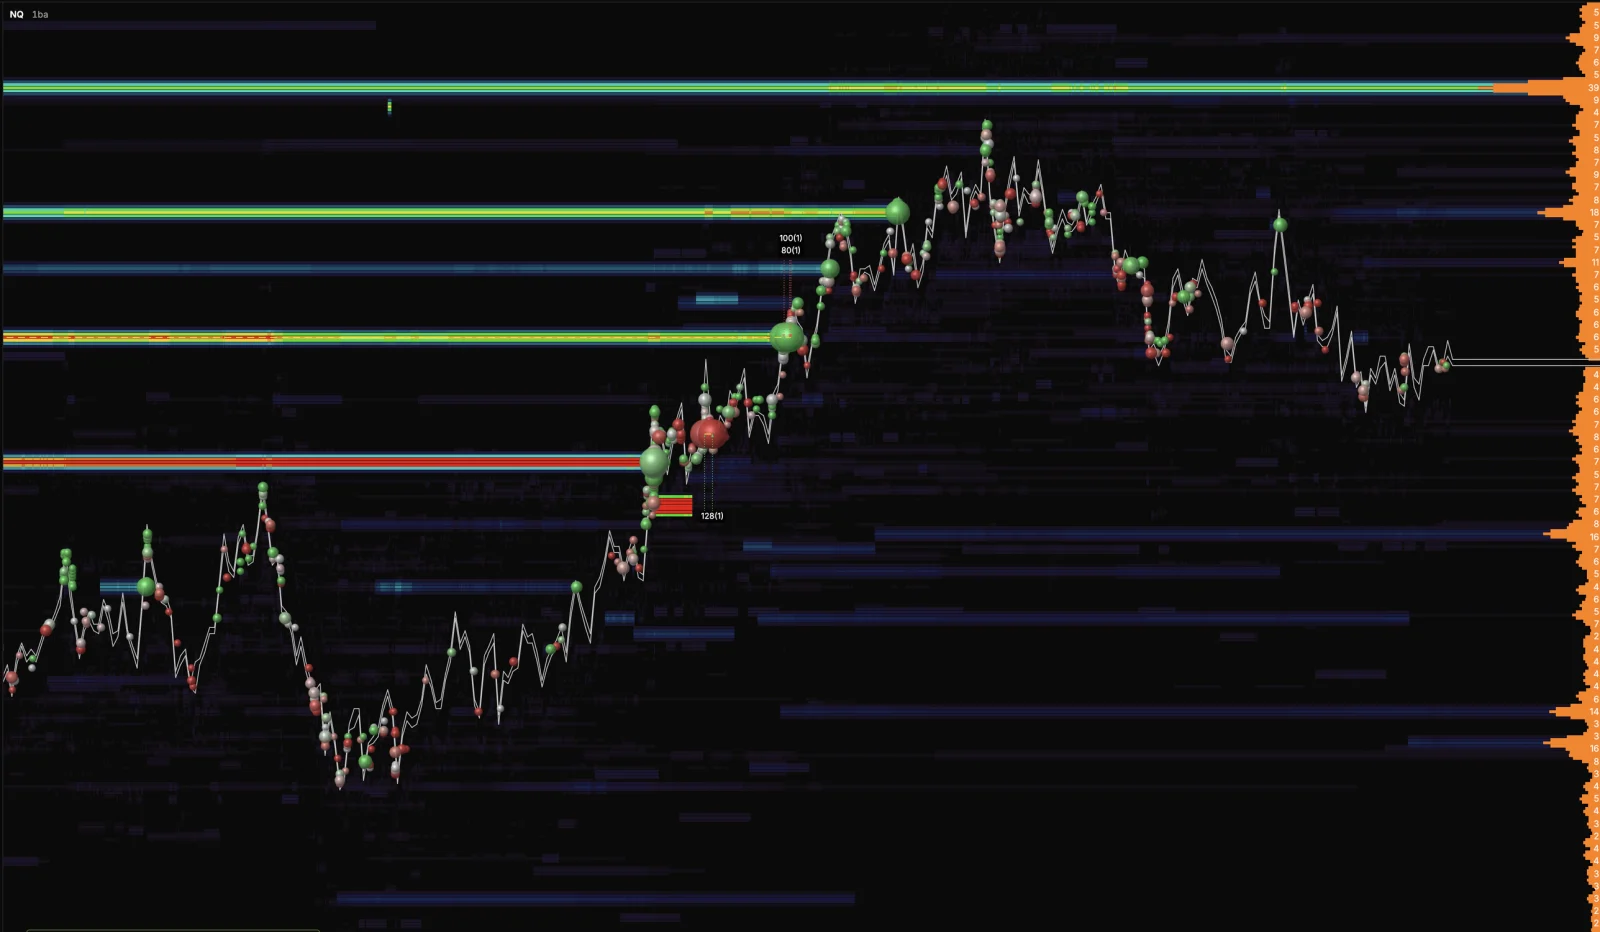
Until now every window in XFlow Charts was a price chart. This release adds three surfaces of their own: a full price ladder, a tape and a tick level heatmap.
All three are open to every account and carry a BETA label. The same week brought a much more capable Indicator Builder and a shared data hub for replay.
New Chart Kinds
- The plus menu now offers Price chart, Depth of Market, Time and Sales and Tick Heatmap.
- A split frame can hold a DOM, a Time and Sales tape or a Tick Heatmap, and any frame can be opened in its own window.
- The new windows keep their settings and named templates across devices.
Depth of Market
- Click trading on the ladder. A buy above the price is a stop and below it a limit, mirrored for sells, with market orders from the buttons and a right click to cancel.
- Works on simulated and live Rithmic accounts through the same order path as the trading panel, including Auto SL and TP.
- Columns always fill the window and resize smoothly, with session profile columns, pull and stack, session stats and P&L.
Time and Sales
- A tape window that starts from the moment you open it, with size filters and a tape speed meter.
- Order (MBO) mode with one row per aggressive order and the largest resting orders it consumed.
- Resizable columns shared with the DOM, and a tape that never scrolls away from the newest print.
Profiles and Footprint
- New Session TPO in the profile family, with open and close markers.
- Footprint imbalances gain border and background controls and tier colours.
- HFT candles can be drawn as a footprint or a footprint profile.
Indicator Builder
- XFlow Script now reads L1, L2, L3 and GEX data, the footprint ladder and custom volume profiles.
- Scripts can raise alerts and popups and define their own big trade rule.
- Builder indicators render on the GPU and stay locked to their candles when you pan.
- Every indicator calculation now runs in WebAssembly.
Replay
- One shared replay data hub per browser, so tape, clock, GEX and depth are loaded once for every window and panel.
- Reloading a replay needs no new downloads for past days that are already loaded.
- Every hold in replay now names its reason and offers a way out.
Apps
- Desktop app 1.0.15, 1.0.16 and 1.0.17 for macOS and Windows. With 1.0.17 the app has floating replay controls you can move to any screen, a View menu with zoom, and windows that remember their size.
- Phone app 1.0.17.
- The app downloads and the license key are now visible to every license holder.
Fixes
- Fixed a third chart window showing Chart not found in the desktop app.
- Fixed Effort Zones blinking out for a frame.
- Fixed the Open chart button doing nothing when the browser blocked the new window.
- Fixed the replay loading cover lifting before the tape of the starting day had loaded.
- Fixed Effort Zones losing zones when stepping back in replay.
Final Notes
This release gave XFlow Charts its first windows that are not a price chart.
Tell us how the new windows fit your workflow. That feedback decides what gets refined first.