AlphaNew FeaturesImprovementsFixes
XFlow Charts Version 0.321 Release Notes
This release is about what you can put on the chart and how it looks. You can now write your own indicators, three of ours are open to every account, and the chart has a full set of styles.
Below is what changed.
Indicators
- New Indicator Builder for writing your own indicators.
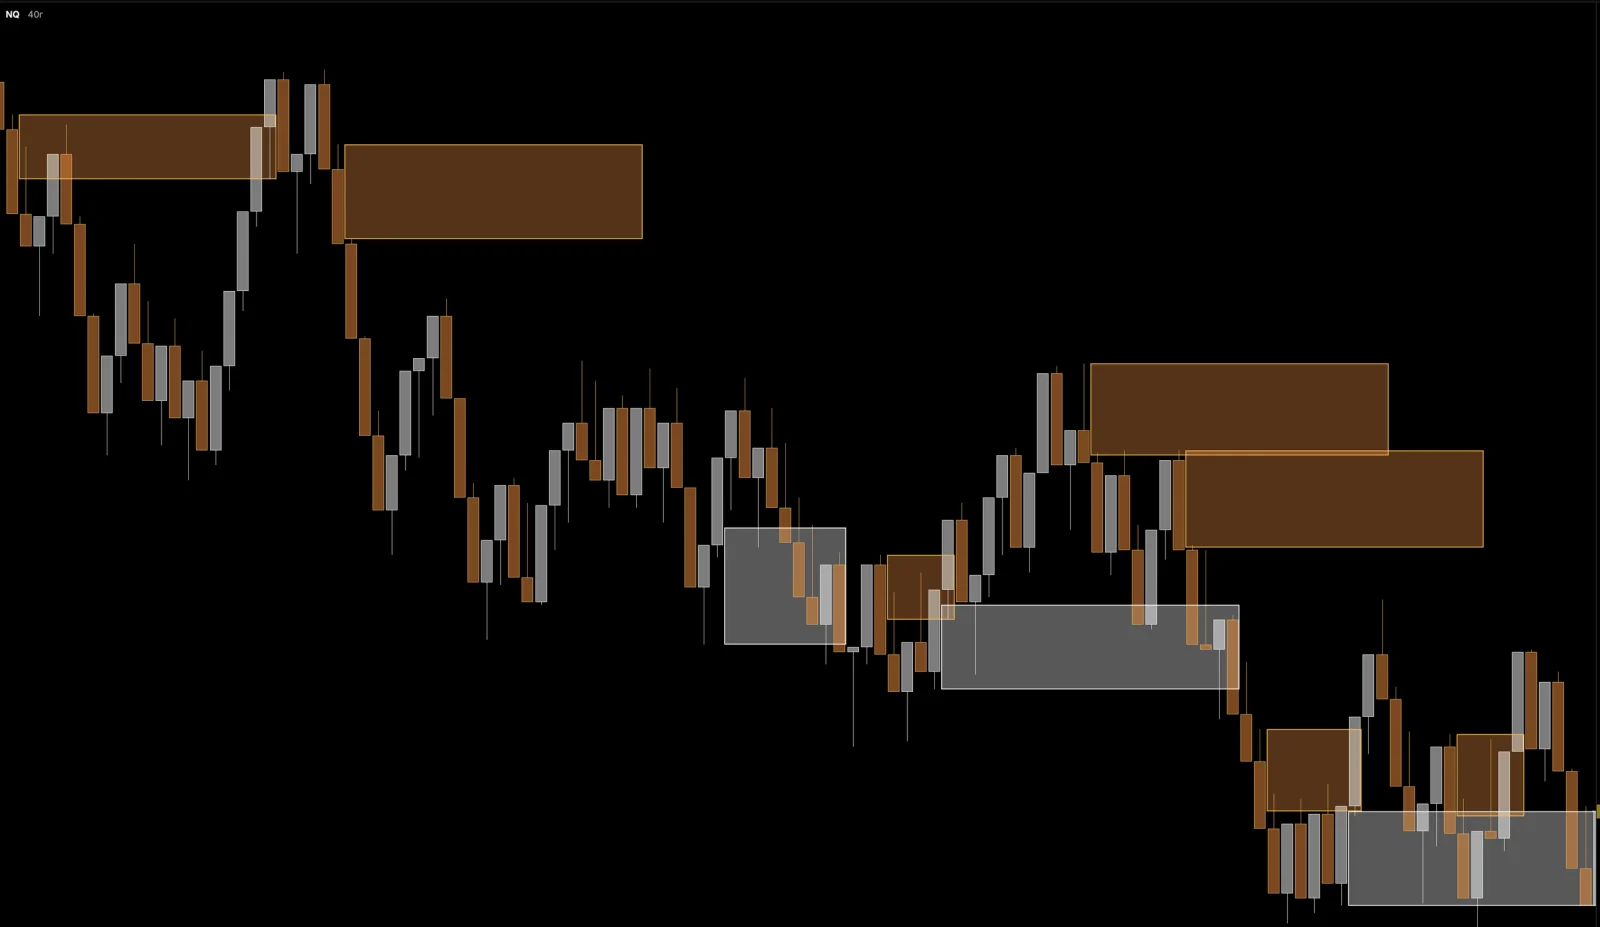
- Effort Zones, FVG and Range Absorption are now available to every user.
- VWAP gains line styles, trend colouring and granularity.
- Volume profiles gain peaks and valleys.
Chart
- Eleven chart styles and one merged Chart Type control.
- One candle geometry everywhere, and indicator colours follow the chart.
- Themes for the chart interface, with a light theme that is designed rather than mirrored from dark.
- Trading panel styles and a new workspace dialog.
Data
- Dated contracts and deeper history, with a loading card that says what it is loading.
- Session calendars per instrument.
- Replay always runs on the stitched contract series.
Performance
- Sub panels and columns now render through WebGL, with panel calculations in WebAssembly.
- Resizing a composite profile is forty seven times faster.
- Crisp text at fractional zoom levels.
Fixes
- Fixed Auto SL/TP losing one of its two orders.
- Fixed the workspace labels being invisible in the light theme.
Final Notes
This update put indicator writing in your hands and moved the last panels onto the GPU.
As always, your feedback continues to guide what we build next.